IC Markets Home Sign in Web Trader Contact Us
IC Markets Social IC Markets Social

Information Hub for
Serious Traders

  • ABOUT US
  • OPEN LIVE ACCOUNT
  • OPEN DEMO ACCOUNT
  • TRADE NOW
  • VISIT OUR BLOG
IC Markets Social
  • ABOUT US
  • OPEN LIVE ACCOUNT
  • OPEN DEMO ACCOUNT
  • TRADE NOW
  • VISIT OUR BLOG
June 7, 2021North_American_Stocks_enIC Markets

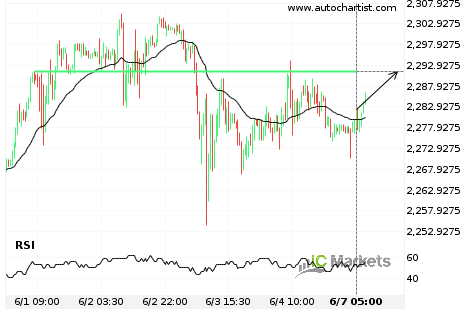
US Small Cap 2000 Index – getting close to psychological price line

US Small Cap 2000 Index is moving towards the resistance line of a Resistance. Because we have seen it retrace from this positions in the past, we could see either a break through this line, or a rebound back to current lines. It has touched this line numerous times in the last 6 days and […]

Read more
June 4, 2021North_American_Stocks_enIC Markets

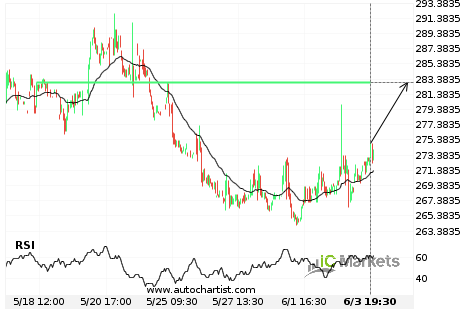
Biogen Idec Inc – getting close to psychological price line

Biogen Idec Inc is moving towards the resistance line of a Resistance. Because we have seen it retrace from this positions in the past, we could see either a break through this line, or a rebound back to current lines. It has touched this line numerous times in the last 17 days and may test […]

Read more
June 3, 2021North_American_Stocks_enIC Markets

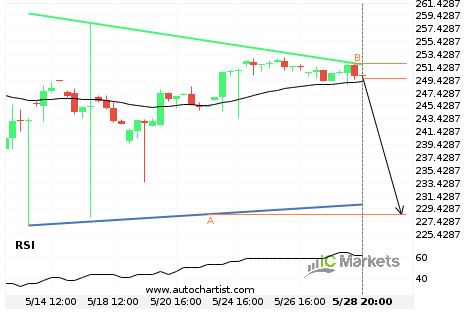
Breach of support line imminent by Apple Inc.

Apple Inc. is moving towards the support line of a Triangle which it has tested numerous times in the past. We have seen it retrace from this line before, so at this stage it isn’t clear whether it will breach this line or rebound as it did before. If Apple Inc. continues in its current […]

Read more
June 2, 2021North_American_Stocks_enIC Markets

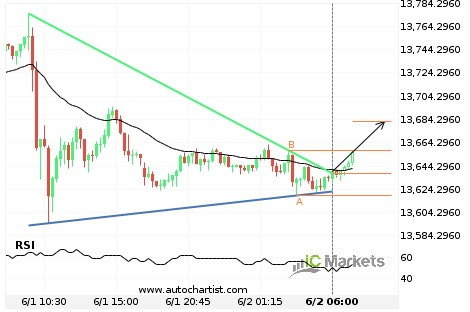
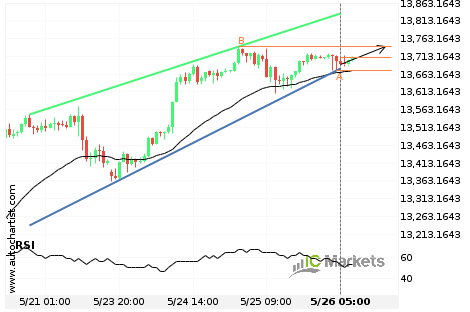
Should we expect a bullish trend on US Tech 100 Index?

The breakout of US Tech 100 Index through the resistance line of a Triangle could be a sign of the road ahead. If this breakout persists, we expect the price of US Tech 100 Index to test 13682.5393 within the next 5 hours. One should always be cautious before placing a trade, wait for confirmation […]

Read more
June 1, 2021North_American_Stocks_enIC Markets

US Small Cap 2000 Index approaching resistance of a Rising Wedge

US Small Cap 2000 Index is approaching the resistance line of a Rising Wedge. It has touched this line numerous times in the last 14 days. If it tests this line again, it should do so in the next 3 days.

Read more
May 31, 2021North_American_Stocks_enIC Markets

Microsoft Corporation approaching support of a Triangle

Microsoft Corporation is approaching the support line of a Triangle. It has touched this line numerous times in the last 16 days. If it tests this line again, it should do so in the next 3 days.

Read more
May 28, 2021North_American_Stocks_enIC Markets

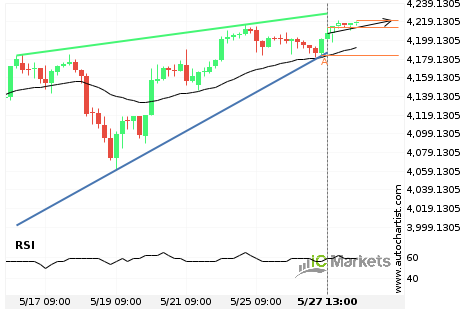
Either a rebound or a breakout imminent on US SPX 500 Index

US SPX 500 Index is heading towards the resistance line of a Rising Wedge. If this movement continues, we expect the price of US SPX 500 Index to test 4220.1000 within the next 2 days. But don’t be so quick to trade, it has tested this line numerous times in the past, so this movement […]

Read more
May 26, 2021North_American_Stocks_enIC Markets

Will US Tech 100 Index have enough momentum to break resistance?

US Tech 100 Index is heading towards the resistance line of a Rising Wedge and could reach this point within the next 22 hours. It has tested this line numerous times in the past, and this time could be no different from the past, ending in a rebound instead of a breakout. If the breakout […]

Read more
May 25, 2021North_American_Stocks_enIC Markets

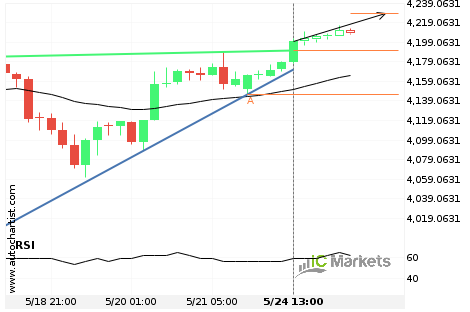
Resistance line breached by US SPX 500 Index

US SPX 500 Index has broken through the resistance line which it has tested twice in the past. We have seen it retrace from this position before, so one should wait for confirmation of the breakout before trading. If this new trend persists, a target line of around 4228.2490 can be expected within the next […]

Read more
May 24, 2021North_American_Stocks_enIC Markets

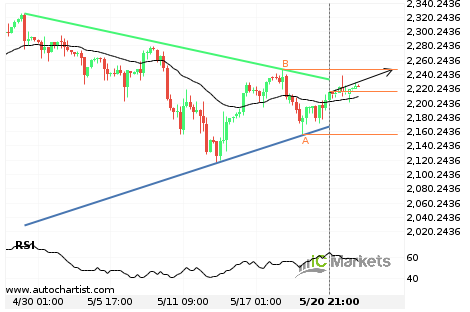
Will US Small Cap 2000 Index have enough momentum to break resistance?

US Small Cap 2000 Index is heading towards the resistance line of a Triangle and could reach this point within the next 2 days. It has tested this line numerous times in the past, and this time could be no different from the past, ending in a rebound instead of a breakout. If the breakout […]

Read more
  • 1
  • 2
  • 3
  • …
  • 35
  • 36
  • 37
  • 38
  • 39
  • 40
  • 41
  • …
  • 45
  • 46
  • 47

Recent Posts

  • Either a rebound or a breakout imminent on SILVER
  • GOLD Nível visado: 2976.3601
  • A potential bearish movement on GOLD
  • มีโอกาสเกิดการเคลื่อนตัวแบบ bearish บน GOLD
  • Posible gran movimiento en el AUDJPY

Recent Comments

    Translation


     Edit Translation

    Trade with

    a market leader you can rely on

    Open Trading Account Try a Free Demo

    Forex Trading

    • Accounts Overview
    • Open an Account
    • Launch Web Trader

    Trading Specifications

    • Spreads and Commissions
    • Range of Market
    • Trading Hours
    • Funding
    • Withdrawal

    About IC Markets

    • Help Center
    • Why IC Markets
    • Regulation
    • Legal Documents
    • Contact Us


    Forex Trading

    • Accounts Overview
    • Open an Account
    • Launch Web Trader

    Trading Specifications

    • Spreads and Commissions
    • Range of Market
    • Trading Hours
    • Funding
    • Withdrawal

    About IC Markets

    • Chat with a Specialist 24/7
    • Why IC Markets
    • Regulation
    • Legal Documents
    • Contact Us

    Disclaimer: This material is marketing material where all marketing material is published for informational purposes only. This material does not contain and should not be considered as containing - investment advice and recommendations, or suggestions for performing any actions with financial instruments. The built-in widgets belong to their external independent authors, and IC Markets is not responsible for their content and their impact on trade.

    All content rights reserved. Opinions of the authors may not coincide with the opinion of the blog editors. When copying materials from this site or connecting to an RSS feed to republish our articles, a link to IC Markets or attribution in the format ‘IC Markets Blog’ is required. For general questions, please contact the editorial office via the form on the Contact us page.

    Risk Warning: Trading Derivatives carries a high level of risk to your capital and you should only trade with money you can afford to lose. Trading Derivatives may not be suitable for all investors, so please ensure that you fully understand the risks involved and seek independent advice if necessary. A Product Disclosure Statement (PDS) should be considered before entering into a transaction with us.

    The contents of this page are general information only and does not take into account your personal situation, financial objectives or needs. It is up to you to make sure the products that we offer suit your specific needs. You should not trade with us unless you understand the features and risks of the products that we offer. This means that you might need to seek independent advice before you start trading with us.

    © 2022 Raw Trading Ltd | All rights reserved.
    • Sample Page